
How do I record meter readings and track my consumption?
With meter readings you keep an eye on your consumption of electricity, gas, water or heating – without any paperwork. You create one entry per meter, report the current reading regularly and see the history as a chart. The video shows the flow in a little over half a minute.
Step by step
- Open the Meter readings entry in the menu.
- Click + Meter in the bar at the bottom and give it a name and the unit, e.g. kWh or m³.
- Optionally pick a meter type (electricity, water, gas, heating) – its symbol appears before the name in the overview.
- Optionally add a photo of the meter – use Focus to mark the area that stays visible.
- Open the meter and click + Report reading.
- Enter the value, check the date and optionally add a note.
- Add a photo of the meter if you like – several images are possible.
- Save – Planbiene calculates the consumption from it.
Reading consumption in the chart
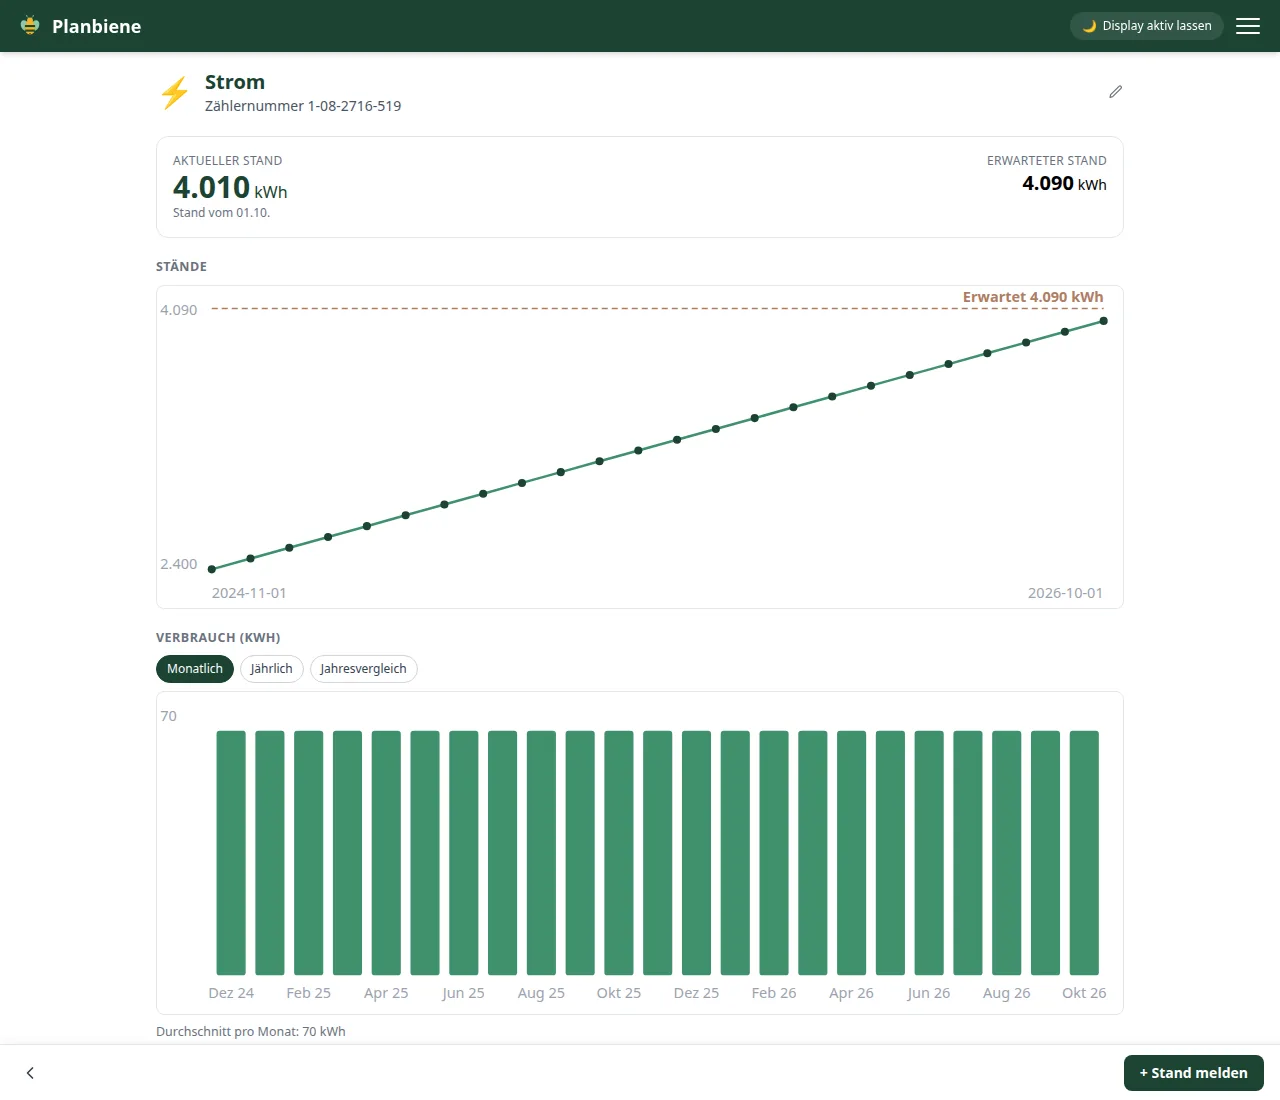
On the detail page, the top line shows the absolute history of the readings. The bars below show the consumption – switchable between Monthly, Yearly and Year comparison.
Note: Photos are stored directly in the app's database, not with an external
image service. Use Edit to change a meter or a reading afterwards, and
Archive to hide a meter without losing its history.
All details can be found in the Handbook: Meter readings.