
⏲️ Meter readings
Meter readings keep track of your consumption of electricity, gas, water or heating – without any paperwork. You create one entry per meter in the household and report the current reading regularly, with a photo as proof if you like. Planbiene calculates the consumption between two readings from that and shows the history as a chart.
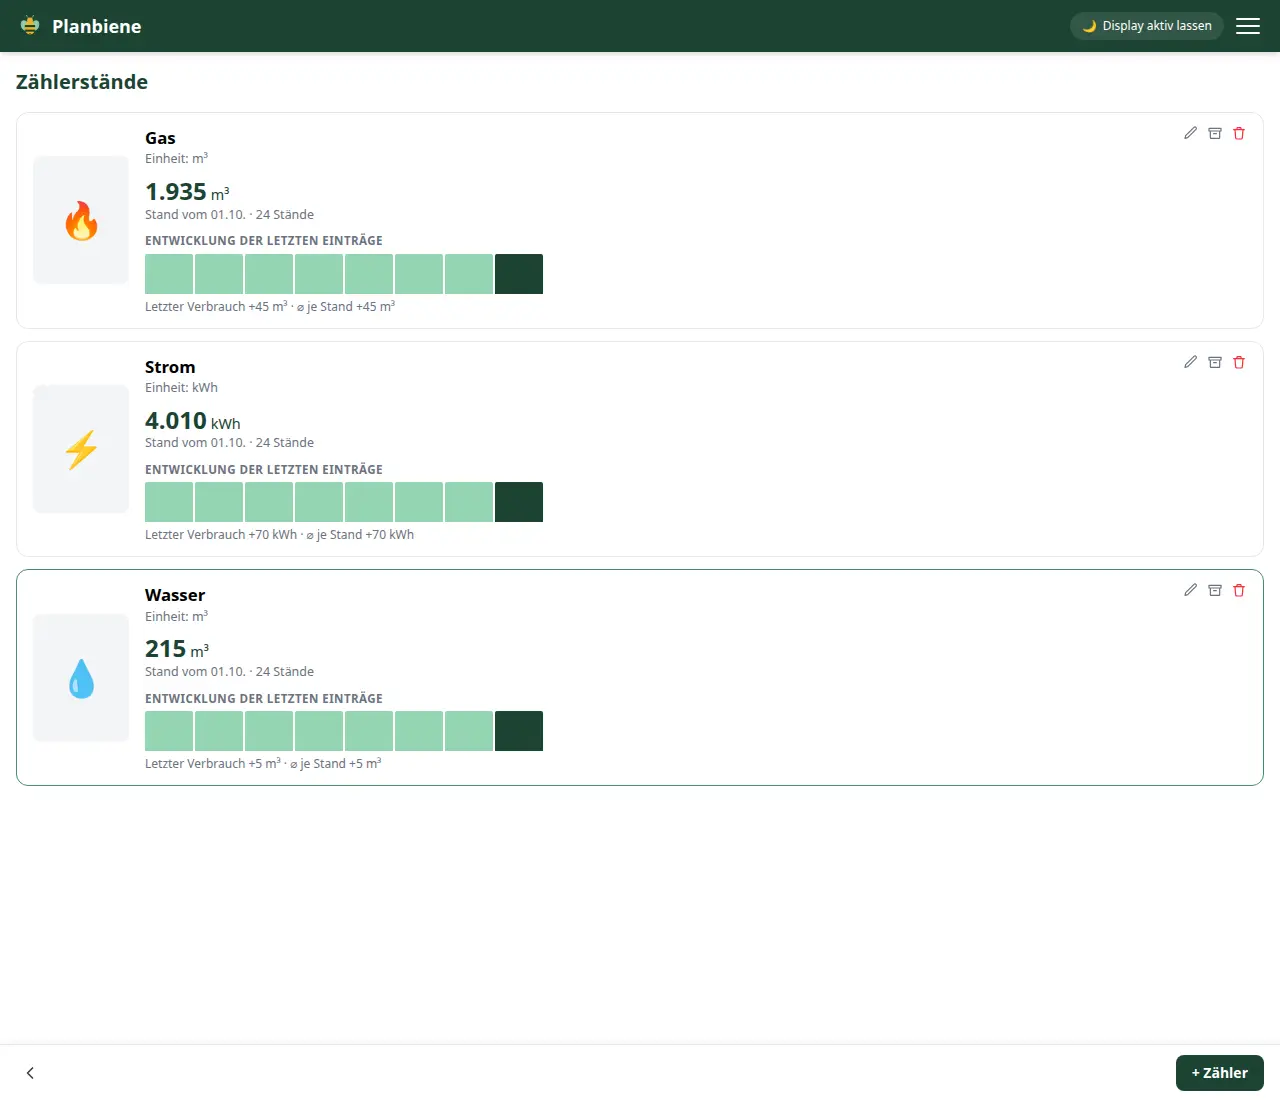
Creating a meter
- Open the Meter readings entry in the menu.
- Click + Meter in the bar at the bottom.
- Give it a name, e.g. "Electricity meter basement".
- Enter the unit, e.g. kWh, m³ or l.
- Optionally pick a meter type (electricity, water, gas, heating) – its symbol appears before the name in the overview.
- Optionally add a description, e.g. the meter number or the provider.
- Optionally add a photo of the meter, e.g. its location or type. Use Focus to mark the area that stays visible in the detail view.
Reporting a reading
On a meter's detail page you find the + Report reading button at the bottom. Enter the value you read off and check the date (it defaults to today). A note is optional.
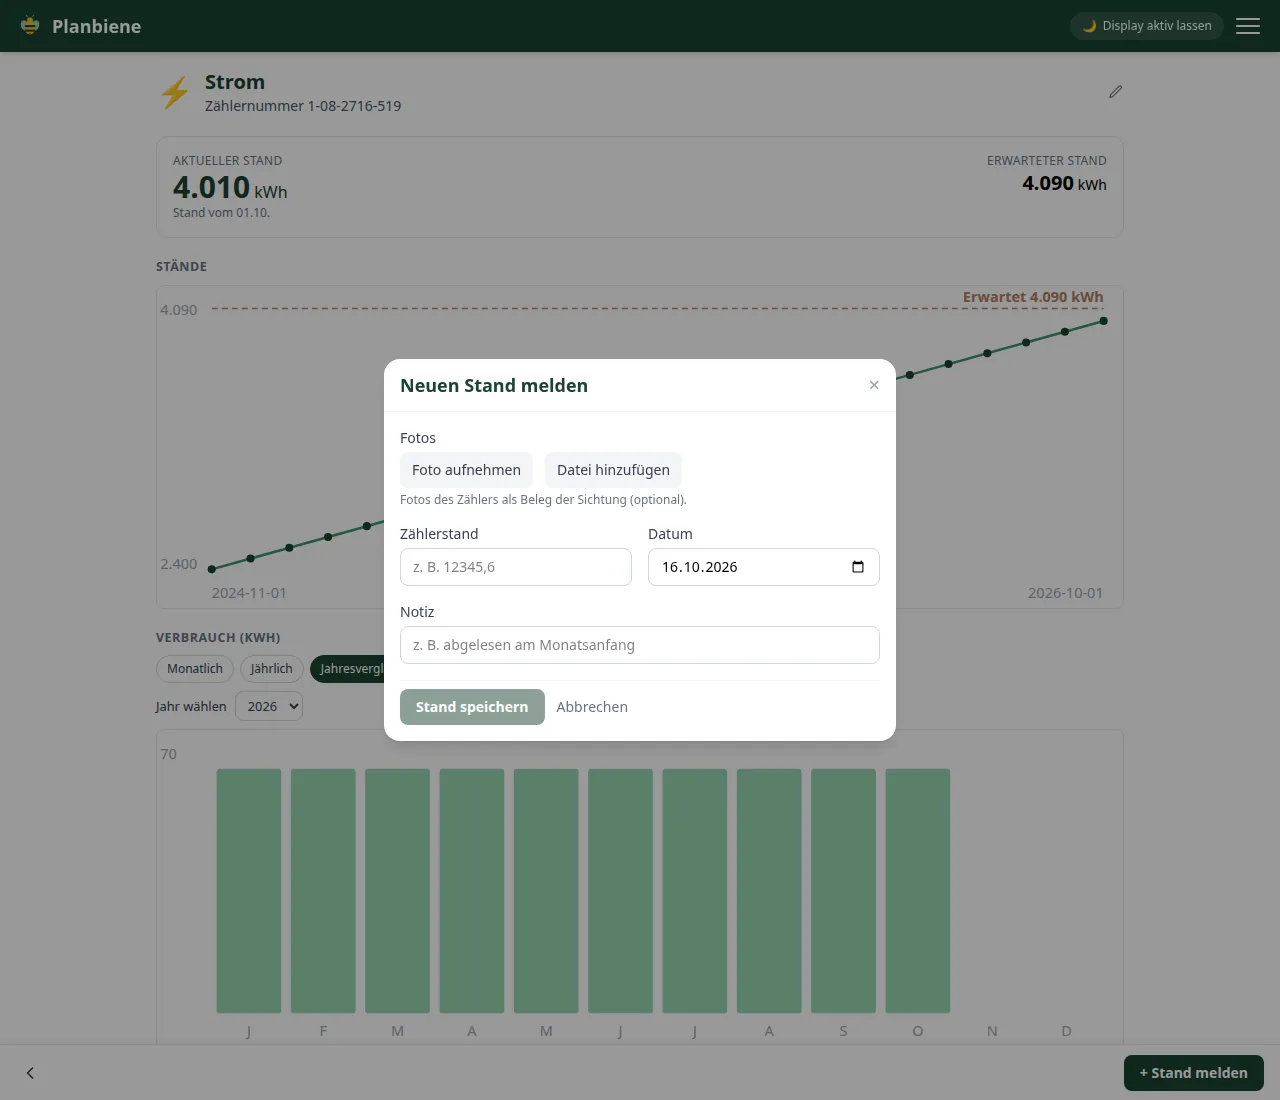
You can add photos to every reading – several are possible, e.g. the meter box and the meter number. Small images are enough: the photo only serves as proof and is scaled down automatically before saving.
History and consumption in the chart
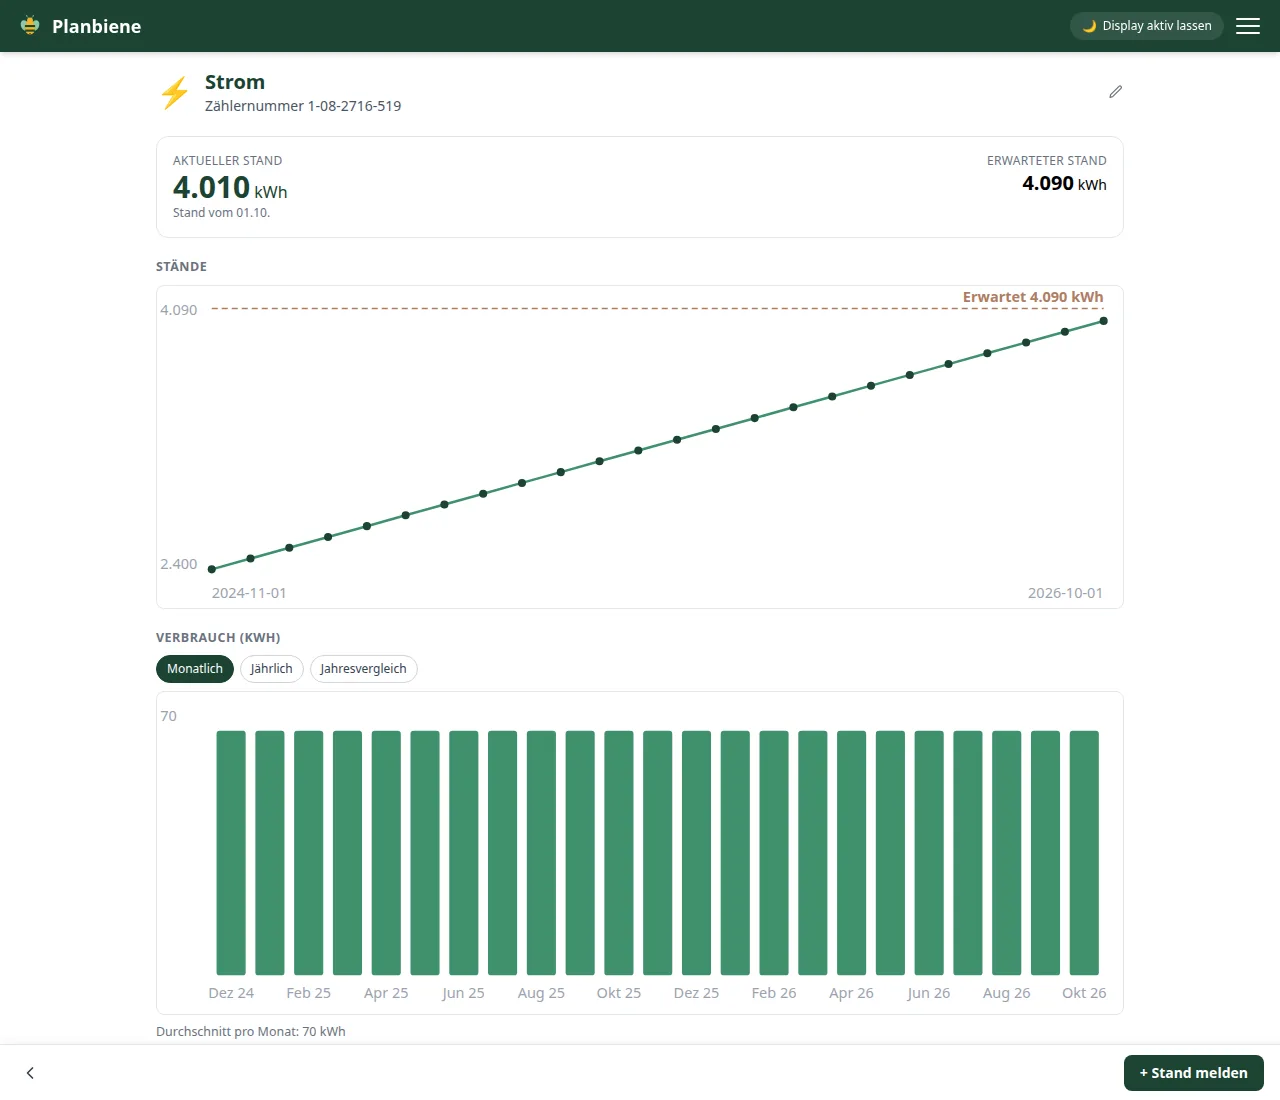
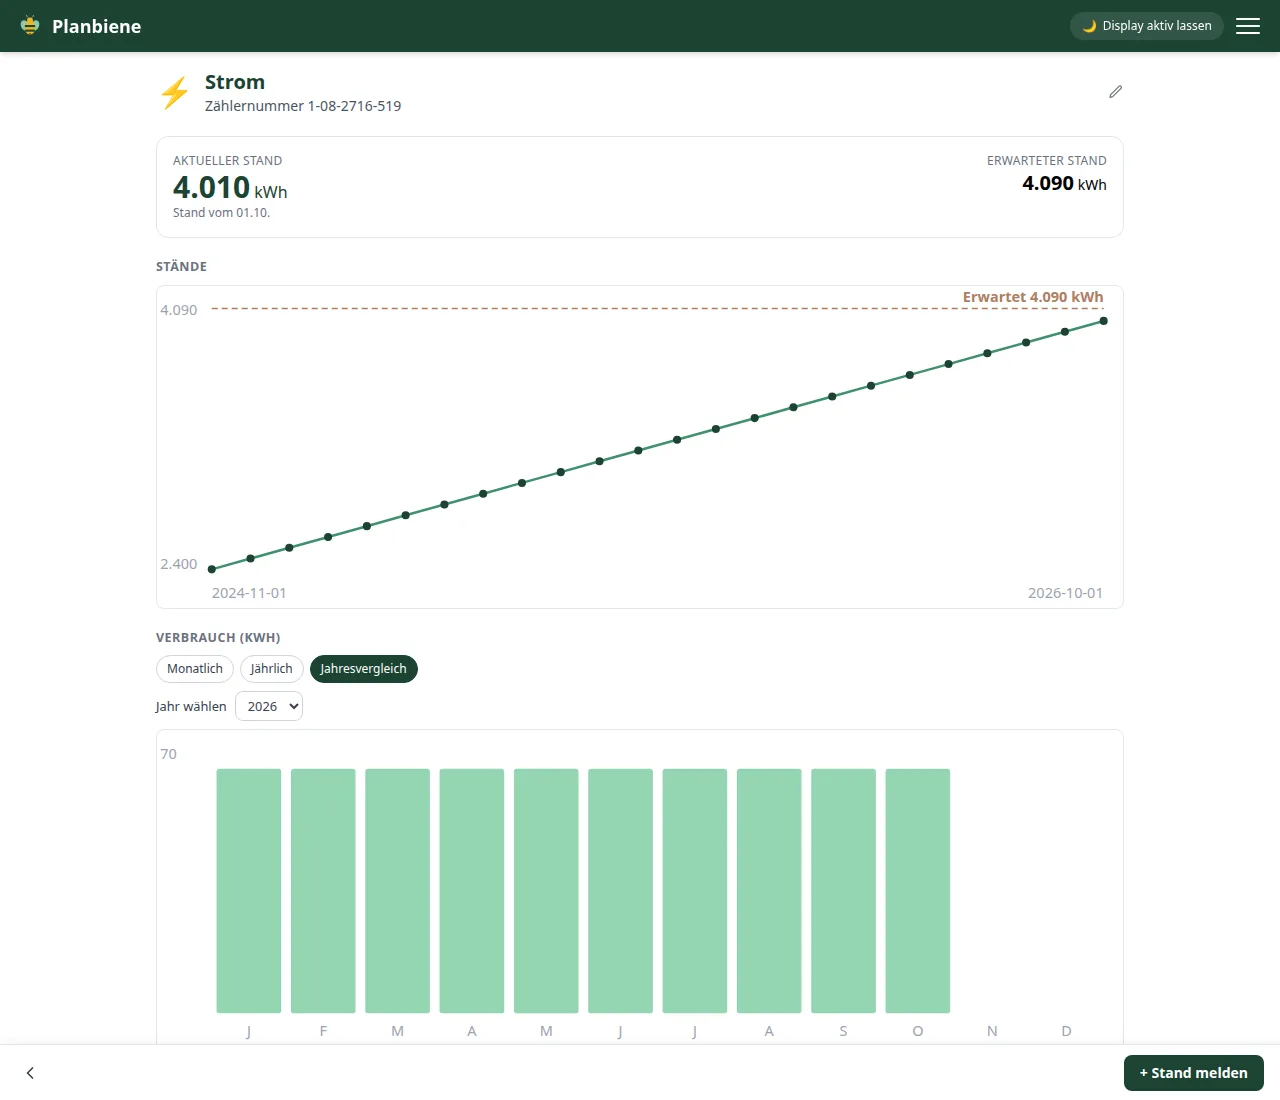
The detail page shows the absolute history of the readings as a line at the top. Below it, the consumption appears as a bar chart with three views:
- Monthly – the consumption per month.
- Yearly – the total per year.
- Year comparison – the months of one year side by side, to compare the same months across years.
Consumption always comes from the difference to the previous reading; the average per month is shown below the chart.
Editing, archiving and deleting
Use the pencil icon to edit a meter or a single reading, and the trash can icon to remove it. Archive hides a meter from the active list without losing its history – Show archived brings it back.
Why record meter readings?
Typical situations from everyday life:
- Prepare the annual bill: have the readings for the cut-off date ready instead of searching the meter box.
- Watch consumption: spot unusual spikes in electricity, gas or water early.
- Share readings between households in a traceable way, e.g. for shared rooms.
- On moving in or out, document the start and end reading with a photo.
Because every reading carries a date and a value, consumption stays traceable without gaps – and with the photo of the meter every figure is backed up.